Descriptive Study of Classifieds Choice
How consistent are 70,000 users on Norway’s largest classifieds platform? We map 1.3 million unique listings to 290 category-geography groups, run SARP, Houtman-Maks, and RUM tests at scale, and compare search versus recommendation behavior.
Platform and Data
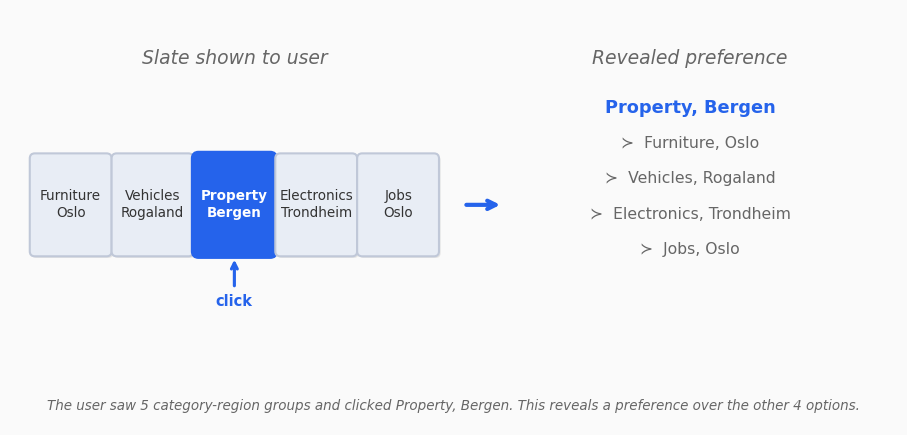
FINN.no is Norway’s leading marketplace for real estate, vehicles, jobs, and general merchandise. The FINN.no Slates dataset (Eide et al., RecSys 2021) records 37.5 million interactions from 2.3 million users over 30 days. Each interaction logs the full slate of items shown and which item was clicked. About 70 percent of slates come from user-initiated search and 30 percent from recommendations. Unlike most recommendation datasets, the choice set is directly observed by the platform rather than reconstructed from browsing sessions.
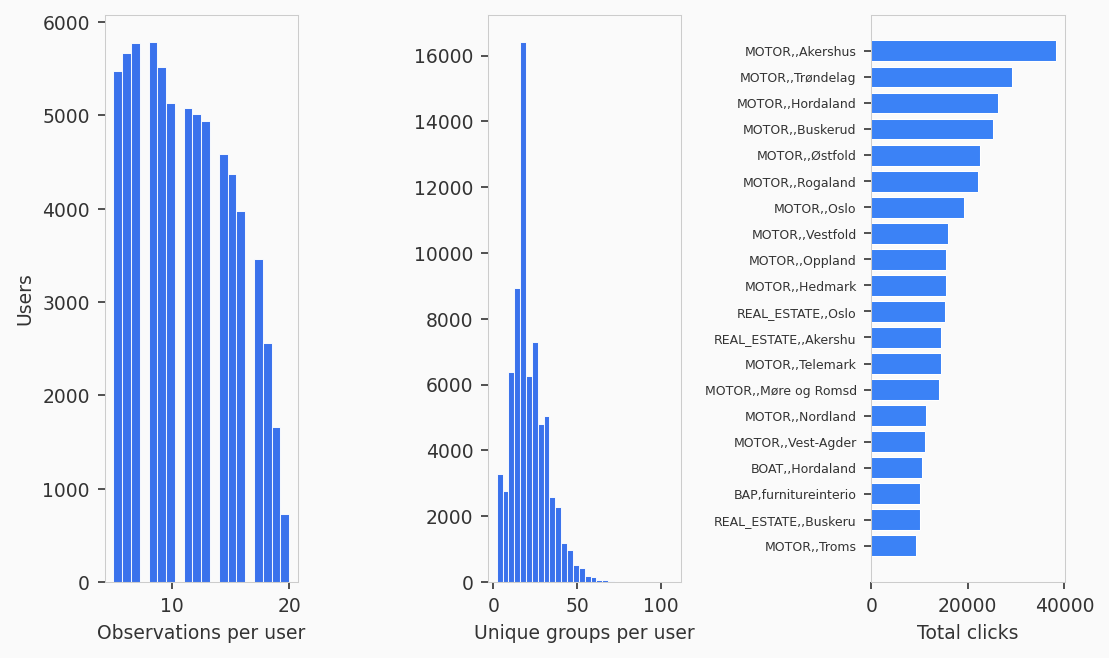
Individual listings are unique, so the same item rarely appears in multiple slates. This study maps each item to one of 290 category-geography groups defined in the dataset metadata. Groups combine a product category with a Norwegian county. BAP is the marketplace section for general goods (electronics, furniture, clothing), MOTOR covers vehicles, REAL_ESTATE covers property, JOB covers job postings, and BOAT covers boats. A group like “MOTOR, Rogaland” means motor vehicles listed in Rogaland county. At the group level, overlap across slates rises from 6 percent to 63 percent, which is dense enough for meaningful SARP and WARP testing.
Results
The table below summarizes the main findings across 69,752 users at the group level, with item-level results for comparison. The Rust Engine processed all 69,752 group-level users in 2.1 seconds.
Metric |
Group (290) |
Item (all) |
Item (dense) |
|---|---|---|---|
Users |
69,752 |
93,858 |
16,708 |
SARP pass rate |
9.6% |
41.5% |
13.6% |
WARP pass rate |
10.0% |
42.0% |
— |
HM ratio (mean) |
0.874 |
0.980 |
0.819 |
HM ratio (median) |
0.889 |
0.991 |
0.833 |
Item overlap |
62.7% |
25.7% |
— |
Random baseline SARP |
7.9% |
— |
— |
The “Item (all)” column treats each unique listing as a separate item. Most users appear highly rational because there are too few repeated items to form preference cycles. The “Item (dense)” column restricts to the top 20 percent of users by observation count and keeps only each user’s 50 most frequently chosen items. This filters to the users and items with enough data to actually test consistency. Their results are close to the group-level analysis, which validates the aggregation.
User Profiles
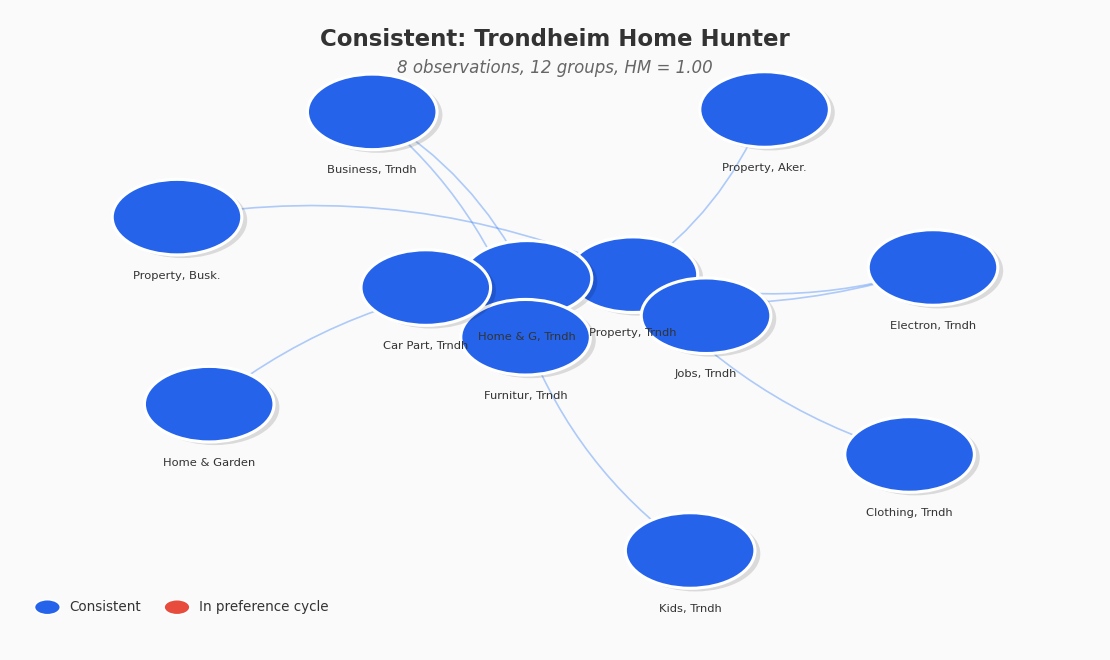
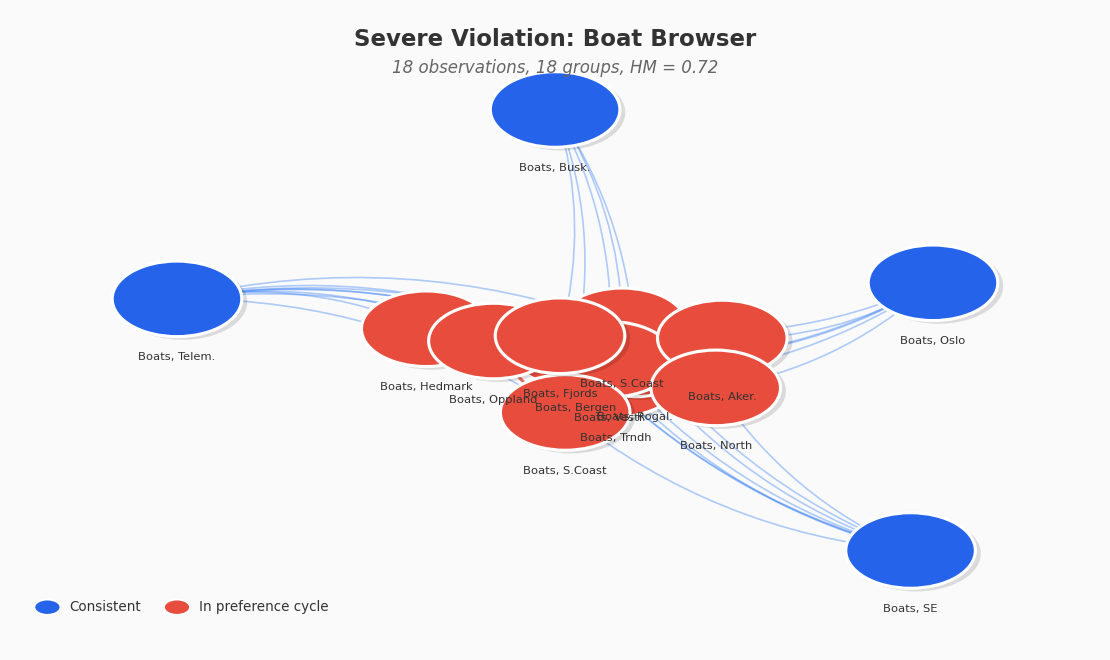
Behind the population averages are individual browsing histories that range from perfectly orderly to deeply tangled. The following three users illustrate what consistency and inconsistency look like in practice. Each node is a category-region group, each arrow means “was chosen over,” and red nodes sit inside a preference cycle.
Consistent user. This user browses property and home improvement listings in the Trondheim area. Over 8 interactions they clicked on 12 different category-region groups without ever contradicting a previous preference. Their preference graph is acyclic and admits a complete ranking. The Houtman-Maks ratio is 1.0.
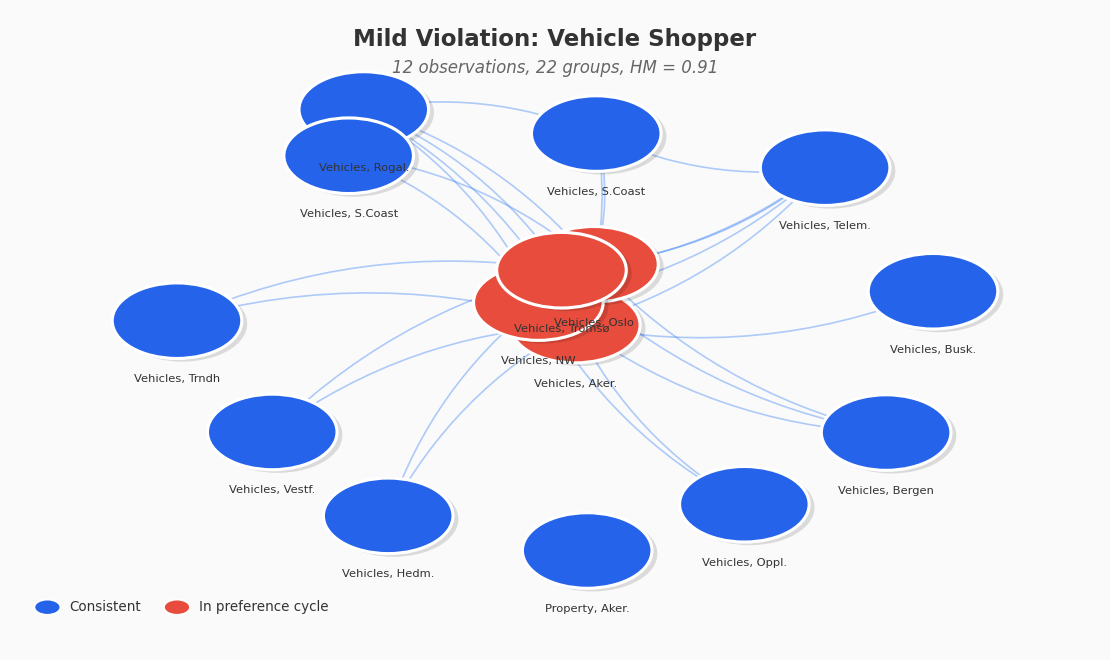
Mild violator. This user shops for vehicles across Norwegian regions. Over 12 interactions they clicked on 22 groups and built up a mostly coherent ranking, but four regional vehicle groups form a small preference cycle. They preferred Akershus vehicles over Oslo vehicles in one session but reversed that preference in another. The Houtman-Maks ratio is 0.91, meaning 91 percent of their choices are consistent with a single ranking and only two observations need to be removed to restore full consistency.
Severe violator. This user browses boat listings across 18 regions over 18 interactions. Eleven of those regions form a single large cycle. The user clicked Boats in Trondheim over Bergen in one session, Bergen over Vestfold in another, and Vestfold over Trondheim in a third, creating interlocking preference loops. The Houtman-Maks ratio is 0.72 and 55 SARP violations were detected. This user does not have a stable regional preference for boats and instead clicks opportunistically across the entire country.
Stochastic Consistency
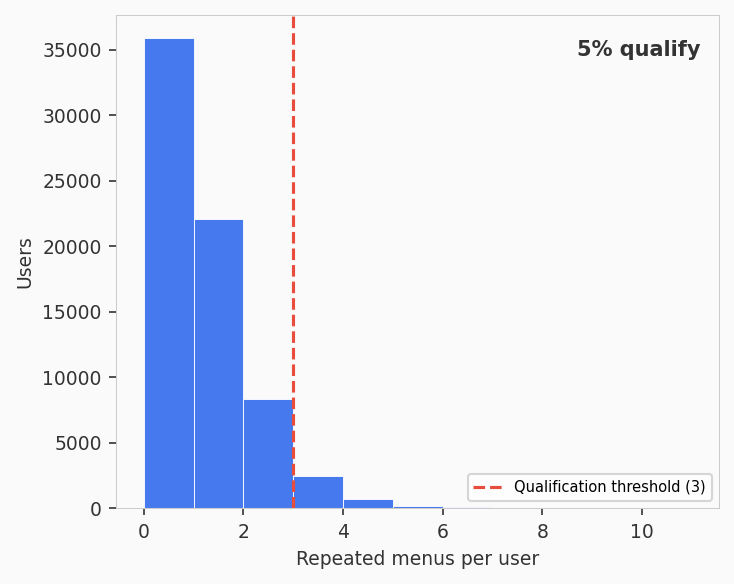
Only 5 percent of users (3,462 out of 69,752) have three or more repeated group-level menus, which is the minimum needed for a Random Utility Model test. Among those who qualify, 6.4 percent pass the RUM test and 75.6 percent satisfy regularity. The combinatorial diversity of slate compositions on a large marketplace limits the applicability of stochastic choice models even after collapsing items into groups.
Search vs Recommendation
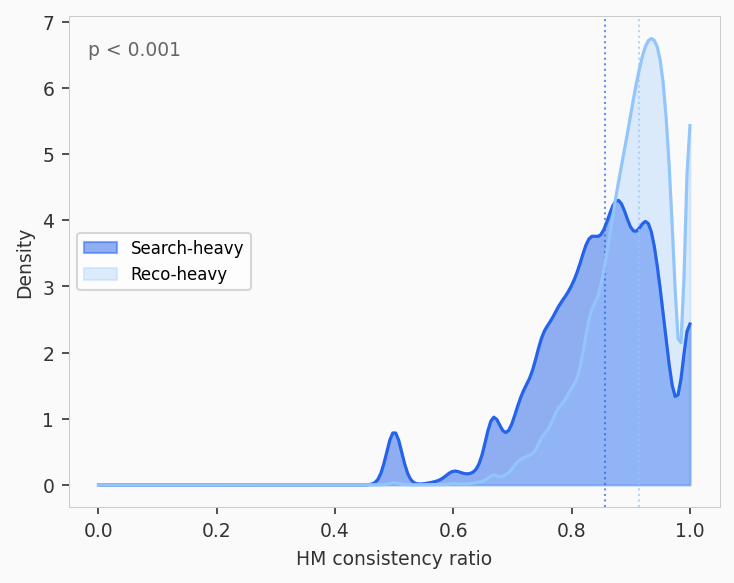
Splitting users at the median search ratio (0.84) produces two groups of roughly 35,000 each. Users who predominantly click from search results are less consistent than recommendation users (median HM 0.857 versus 0.914, SARP pass rate 7.7 versus 11.5 percent, Mann-Whitney p < 0.0001). This is the opposite of the naive expectation that search intent produces clearer preferences. One explanation is that search users browse more diverse categories across sessions while recommendation users see narrower, more repetitive slates.
Violation Anatomy
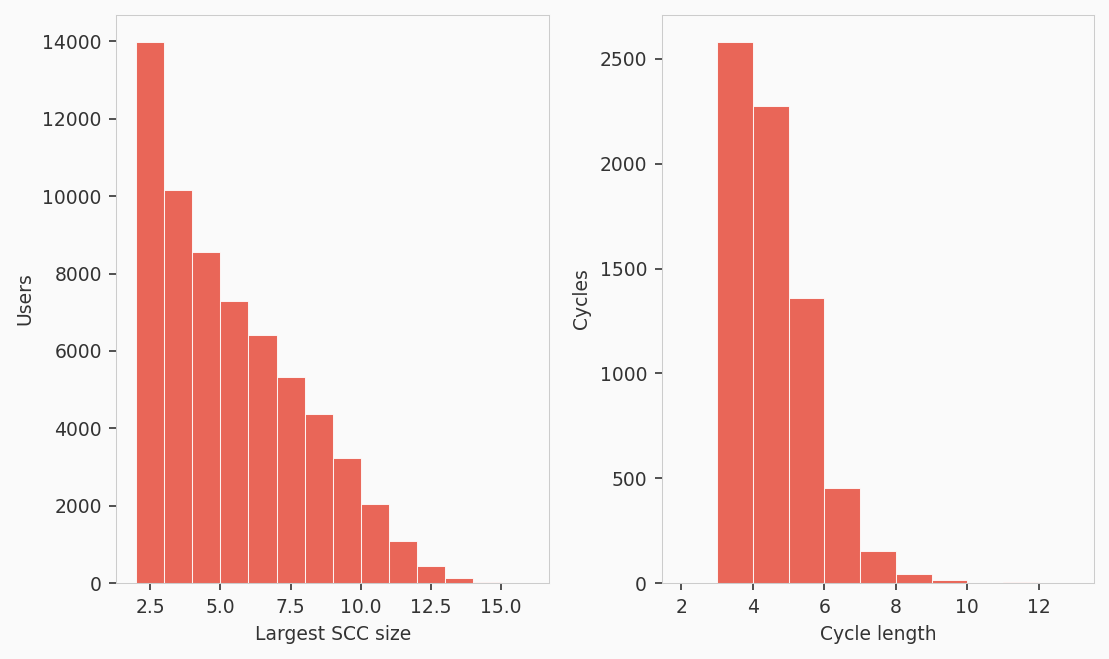
Among the 63,050 users who fail SARP, most violations involve small preference cycles of 4 items on average. The typical largest strongly connected component has 5 groups, suggesting that violations come from a handful of confusable category-geography pairs rather than wholesale randomness.
Pipeline
The analysis uses DuckDB for data loading (13.6 seconds for 100,000 raw users), the Rust Engine for SARP, WARP, and HM batch analysis (2.1 seconds for 69,752 users), and the Rust RUM batch API for stochastic consistency (12.1 seconds for 3,462 users). The full pipeline reproduces in under a minute.
from case_studies.finn_slates.group_loader import load_group_level
from prefgraph import Engine

user_logs, group_labels, stats = load_group_level(max_users=100_000)
engine = Engine()
results = engine.analyze_menus(
    [log.to_engine_tuple() for log in user_logs.values()]
)
python3 case_studies/finn_slates/run_analysis.py --max-users 100000