Recommender Systems
Test whether users’ click patterns from recommendation menus reveal consistent preferences, and use consistency scores for segmentation and churn detection.
Introduction
Every recommendation platform generates the same data: users see a menu of items (search results, playlist tracks, product carousel) and click one. Under the assumption that a click reflects a deliberate preference, these sessions can be modeled as menu-choice observations. If a user clicks item A over B in one session but B over A in another, no fixed ranking can explain the choices — a SARP violation.
Kallus & Udell (2016) formalized scalable preference learning from assortment choice data. Cazzola & Daly (2024) argued that rank-preference consistency — conceptually SARP satisfaction — is a better evaluation metric for recommender systems than RMSE or MAE.
What you’ll learn:
How to map click-stream data into menu-choice observations
The SARP test and Houtman-Maks efficiency for discrete choices
Reconstructing menus from RetailRocket e-commerce sessions
User segmentation by preference consistency
Temporal analysis for churn detection via sliding-window SARP
Companion script: examples/applications/03_recommendation_clicks.py
Formal Setup
SARP
The Strong Axiom of Revealed Preference (Richter, 1966) requires that the transitive closure \(G^*\) of the item graph is acyclic:
SARP holds if and only if the user’s choices can be explained by a strict linear ordering over items. If it fails, no fixed preference ranking rationalizes the data.
Houtman-Maks efficiency
When SARP fails, the Houtman-Maks index measures the minimum fraction of observations to discard to restore consistency:
HM = 1.0 means perfectly consistent. HM = 0.5 means half the observations must be discarded. This is equivalent to finding the maximum acyclic subgraph of the item graph (NP-hard in general, solved by greedy feedback vertex set heuristic).
Data
RetailRocket click-stream
The RetailRocket dataset contains 2.75M events from an e-commerce platform: views, add-to-cart, and transactions with timestamps.
Download:
# Requires Kaggle CLI (pip install kaggle)
kaggle datasets download -d retailrocket/ecommerce-dataset
unzip ecommerce-dataset.zip -d datasets/retailrocket/data/
Menu reconstruction: Items viewed in a session form the menu; the purchased item is the choice. Sessions are split by 30-minute gaps.
Warning
Identification assumption. Revealed preference theory requires exogenous menus — the decision-maker faces a given set and chooses. In click-stream data, menus are endogenous: the recommendation algorithm curates which items each user sees. SARP violations may reflect the recommender showing different assortments over time, not the user having inconsistent preferences. Additionally, viewing an item is not the same as consciously evaluating it; users may click for comparison or curiosity without deliberate preference revelation. Results should be interpreted as descriptive patterns, not causal evidence of preference inconsistency.
from prefgraph.datasets import load_retailrocket

user_logs = load_retailrocket(min_sessions=5, max_users=200)
print(f"Users: {len(user_logs)}")

# Inspect one user
uid = list(user_logs.keys())[0]
log = user_logs[uid]
print(f"User {uid}: {len(log.choices)} sessions, "
      f"{len(set().union(*log.menus))} unique items")
Note
The RetailRocket dataset must be downloaded from Kaggle. See the download instructions above.
EDA: RetailRocket
After loading and session reconstruction:
Statistic |
Value |
|---|---|
Raw events |
2,756,101 |
Unique visitors |
1,407,580 |
Unique items |
417,053 |
Valid sessions (1 purchase, menu >= 2) |
~45,000 |
Users with >= 5 sessions |
~1,200 |
Mean menu size |
4.3 items |
Median menu size |
3 items |
Most sessions have small menus (3–5 items viewed before purchase), which is realistic for e-commerce browse-to-buy funnels. Larger menus (10+ items) represent research-heavy purchases.
Algorithm
The SARP test operates on the item graph (not the observation graph used in GARP). This is a key difference from budget-based analysis:
SARP-TEST(menus M[1..T], choices c[1..T]):
───────────────────────────────────────────
1. BUILD ITEM GRAPH                         O(T × |S|)
   Initialize N×N matrix G ← 0
   For each session t = 1, ..., T:
     For each item a ∈ Mₜ, a ≠ cₜ:
       G[cₜ, a] ← 1    // cₜ revealed preferred to a

2. TRANSITIVE CLOSURE                       O(N³)
   G* ← Floyd-Warshall(G)
   // G*[a,b] = 1 iff a ≻* b (transitive preference)

3. CHECK FOR CYCLES                         O(N²)
   For each pair (a, b):
     if G*[a, b] AND G*[b, a]:
       Record cycle: a ≻* b ≻* a
   Return: is_consistent, violation_cycles

HOUTMAN-MAKS(menus, choices):
─────────────────────────────
4. FIND MIN FEEDBACK VERTEX SET             NP-hard
   Find smallest set S of observations to remove
   such that SARP-TEST(M \ S, c \ S) is consistent
   Greedy heuristic: repeatedly remove observation
   contributing most edges to violation cycles

Total: O(N³) where N = catalog size
Note
Complexity depends on \(N\) (catalog items), not \(T\) (sessions). With 20 items, Floyd-Warshall runs on a 20x20 matrix — nearly instant. With 1,000+ items (large catalogs), consider filtering to frequently-interacted items first.
Pipeline Walkthrough
Single user
from prefgraph import MenuChoiceLog
from prefgraph.algorithms.abstract_choice import validate_menu_sarp
from prefgraph.algorithms.abstract_choice import compute_menu_efficiency

# Using a loaded user
sarp = validate_menu_sarp(log)
print(f"SARP consistent: {sarp.is_consistent}")
print(f"Violations: {sarp.num_violations}")
SARP consistent: False
Violations: 42
hm = compute_menu_efficiency(log)
print(f"HM efficiency: {hm.efficiency_index:.3f}")
print(f"Observations to remove: {len(hm.removed_observations)}/{len(log.choices)}")
HM efficiency: 0.620
Observations to remove: 19/50
This user’s choices require removing 38% of sessions to become SARP-consistent, suggesting moderately noisy preferences.
Batch Analysis
User segmentation
Scoring all users via the Rust Engine (batch SARP/HM):
from prefgraph.engine import Engine

engine = Engine()

# Convert all users to Engine format in one pass
uids = list(user_logs.keys())
users = [log.to_engine_tuple() for log in user_logs.values()]

results = engine.analyze_menus(users)  # Rust/Rayon parallel scoring

# Each MenuResult has: .is_sarp, .n_sarp_violations, .hm_consistent, .hm_total
for uid, mr in zip(uids, results):
    hm_eff = mr.hm_consistent / max(mr.hm_total, 1)
    print(f"  {uid}: SARP={mr.is_sarp}  HM={hm_eff:.3f}")
Segmentation by HM efficiency:
Segment |
HM Range |
Users (%) |
Action |
|---|---|---|---|
Stable preferences |
0.90 – 1.00 |
~30% |
Invest in personalization |
Moderate noise |
0.60 – 0.90 |
~40% |
Balance exploration and exploitation |
Noisy / drifting |
< 0.60 |
~30% |
Invest in curation and defaults |
Beyond SARP: What Else Can You Measure?
After SARP and HM, the same MenuChoiceLog supports further analysis:
from prefgraph.algorithms.abstract_choice import recover_ordinal_utility
from prefgraph.algorithms.attention import test_warp_la

# Recover a preference ranking (requires SARP-consistent subset)
u = recover_ordinal_utility(log)

# Can violations be explained by limited attention?
wla = test_warp_la(log)
Method |
Returns |
Interpretation |
|---|---|---|
|
Ranking + utility values |
Best-fit item ordering from choices |
|
bool + attention filters |
Are violations due to inattention, not irrationality? |
|
bool |
Full rationalizability (SARP + maximality) |
|
Attention probabilities |
P(item considered) per item |
|
Choice probabilities |
Random utility model (Luce/logit) |
When SARP fails but WARP-LA passes, the user has consistent underlying preferences — they just didn’t notice some items. This distinction matters: inattentive users benefit from better UI placement, not different recommendations.
Temporal Analysis: Churn Detection
A proposed application: tracking SARP consistency over time to detect preference drift — a potential leading indicator of churn.
Split-half analysis
For each user, split sessions into first-half and second-half, then batch-score each half via the Engine:
# Build three batches: full, first-half, second-half
full_tuples = [log.to_engine_tuple() for log in user_logs.values()]
fh_tuples, sh_tuples = [], []
for log in user_logs.values():
    mid = len(log.choices) // 2
    fh = MenuChoiceLog(menus=log.menus[:mid], choices=log.choices[:mid])
    sh = MenuChoiceLog(menus=log.menus[mid:], choices=log.choices[mid:])
    fh_tuples.append(fh.to_engine_tuple())
    sh_tuples.append(sh.to_engine_tuple())

# Three batch Engine calls - no per-user Python loops
full_results = engine.analyze_menus(full_tuples)
fh_results = engine.analyze_menus(fh_tuples)
sh_results = engine.analyze_menus(sh_tuples)

# Drift signal per user
for mr_full, mr_fh, mr_sh in zip(full_results, fh_results, sh_results):
    hm_full = mr_full.hm_consistent / max(mr_full.hm_total, 1)
    hm_1 = mr_fh.hm_consistent / max(mr_fh.hm_total, 1)
    hm_2 = mr_sh.hm_consistent / max(mr_sh.hm_total, 1)
    drift_signal = (hm_1 + hm_2) / 2 - hm_full
The key insight:
User Type       Full HM   1st Half   2nd Half   Drift Signal
─────────────   ───────   ────────   ────────   ────────────
Consistent       1.000      1.000      1.000       0.000
Noisy            0.488      0.706      0.757      +0.244
Drifting         0.616      1.000      1.000      +0.384
Random           0.342      0.717      0.717      +0.375
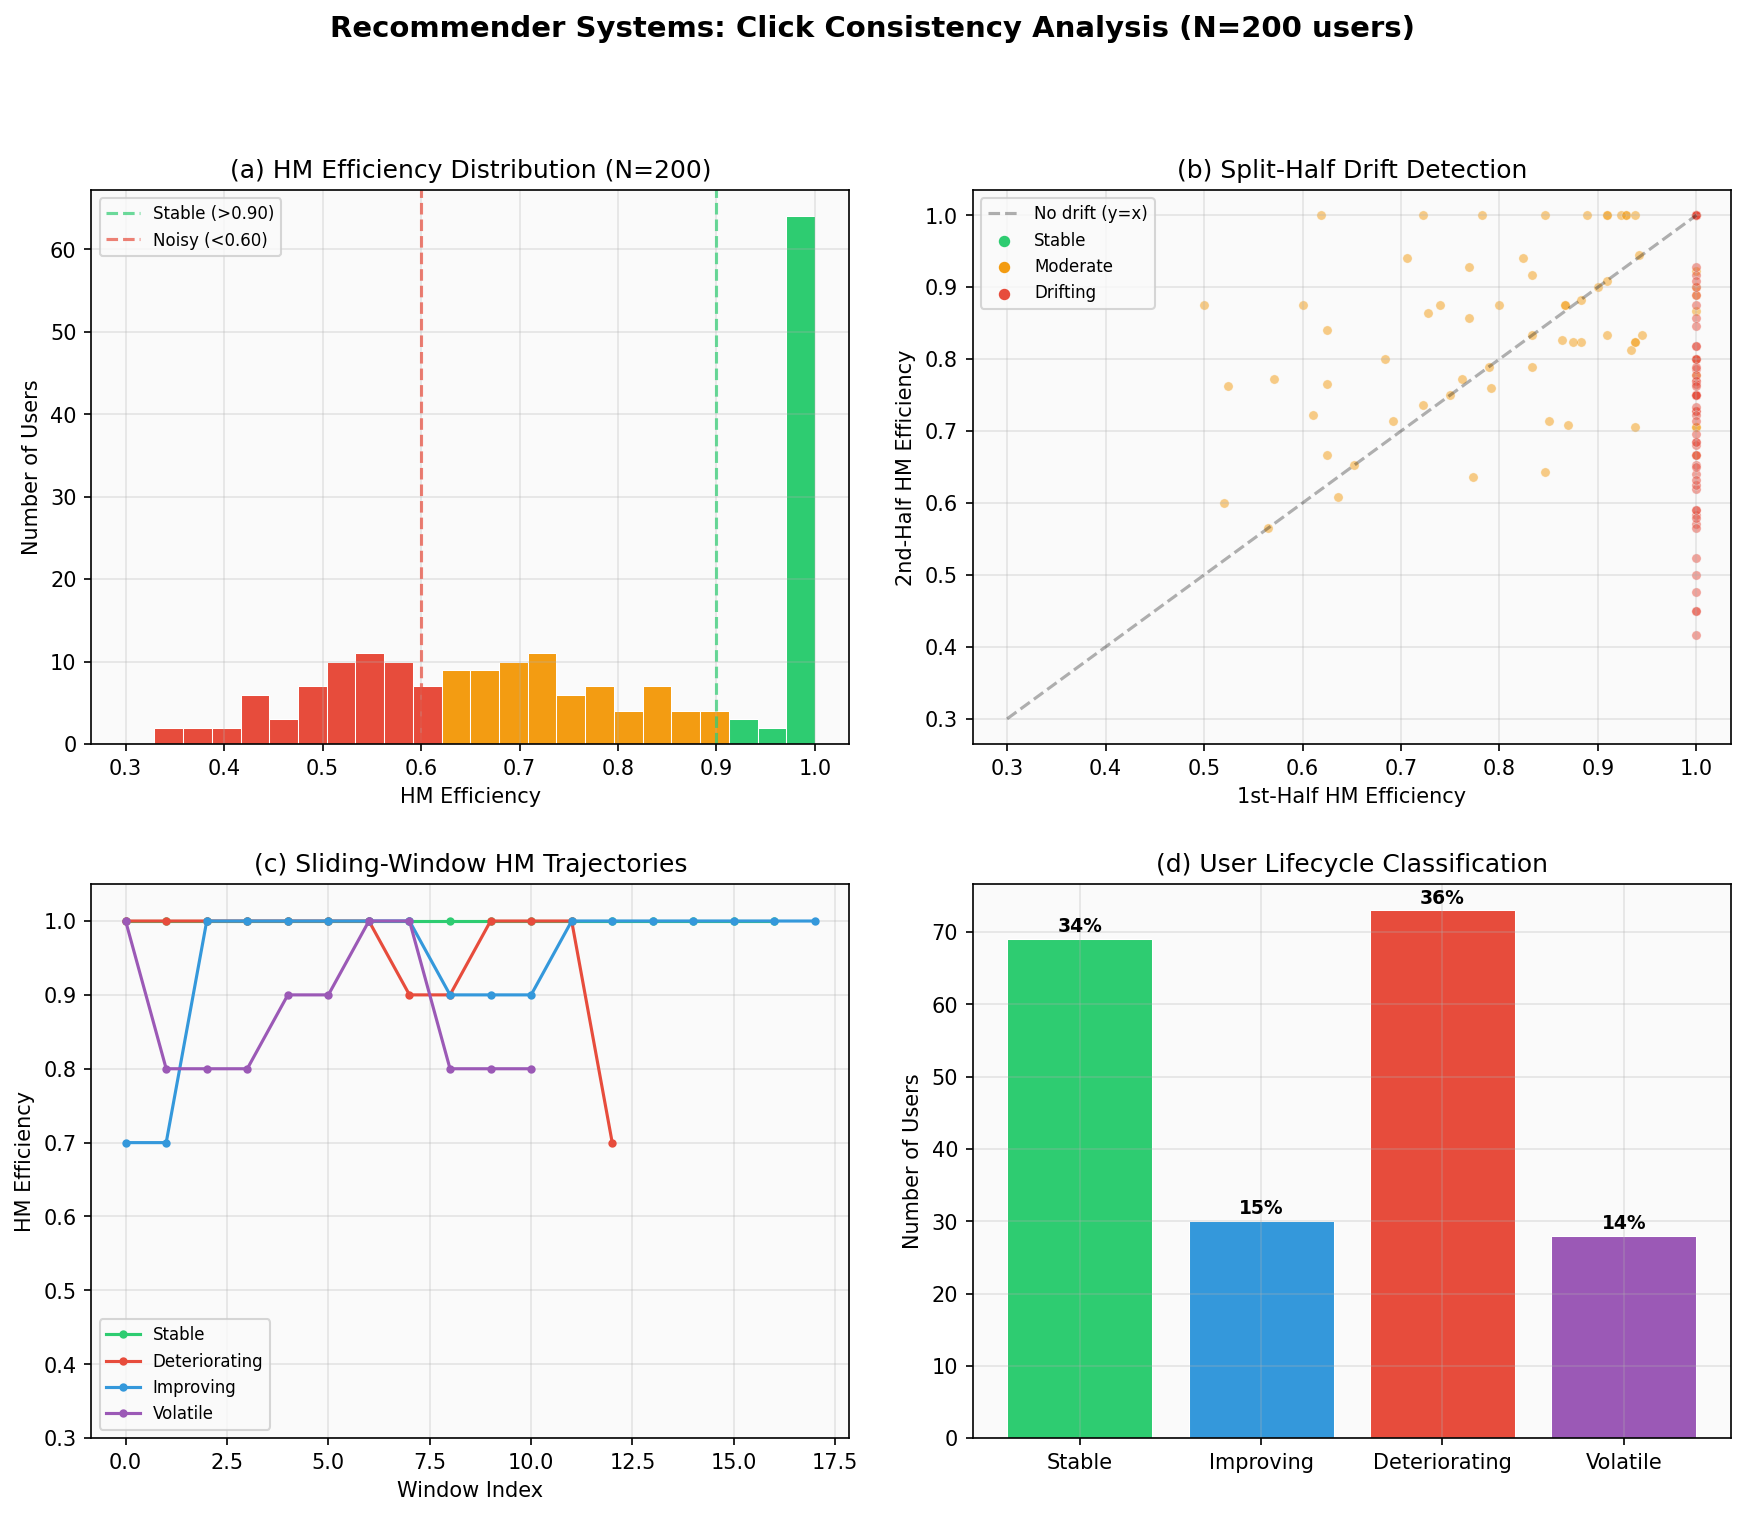
Drifting users show high consistency within each half but low full-sequence consistency, suggesting their preference ranking changed. This pattern — high per-window consistency but low full-window consistency — is a candidate churn signal worth validating against actual engagement data.
Lifecycle classification
Classify each user by the shape of their rolling-window HM trajectory:
Lifecycle |
Criteria |
Action |
|---|---|---|
Stable |
std < 0.05 |
Reliable user; invest in deep personalization |
Improving |
slope > +0.01 |
Preferences crystallizing; increase recommendation specificity |
Deteriorating |
slope < -0.01 |
Preference erosion; early churn signal |
Volatile |
std > 0.05, |slope| < 0.01 |
Context-dependent; emphasize exploration over exploitation |
Note
Validation gap. The lifecycle classification is a descriptive segmentation, not a validated predictor. To test whether “deteriorating” users actually churn, join HM trajectories with engagement outcomes (e.g., days since last session) and evaluate predictive power in a time-forward train/test split. Without such validation, the churn detection claim remains a hypothesis.
Sliding window extension
For production use, compute HM efficiency over a sliding window (e.g., last 20 sessions) and track the trend:
window_size = 20
for start in range(0, len(log.choices) - window_size + 1, 5):
    end = start + window_size
    window_log = MenuChoiceLog(
        menus=log.menus[start:end],
        choices=log.choices[start:end],
    )
    hm = compute_menu_efficiency(window_log).efficiency_index
    # Track hm over time; declining trend = preference drift
Interpretation
Three use cases from one score
Recommender evaluation: In an A/B test with randomized menus, the algorithm yielding higher average SARP consistency elicits more coherent click patterns. (Menu randomization is essential to control for the endogeneity of algorithmic recommendations.)
User segmentation: High-HM users exhibit more predictable click patterns. Low-HM users may benefit more from curated defaults and exploration.
Churn detection (hypothesis): Monitor sliding-window HM efficiency. A declining trend may signal preference drift. This requires validation against actual churn labels before deployment.
Comparison with standard metrics
Metric |
Measures |
Limitation |
|---|---|---|
CTR |
Click rate |
Doesn’t distinguish coherent from random clicks |
RMSE/MAE |
Rating prediction accuracy |
Requires explicit ratings |
NDCG |
Ranking quality vs. ground truth |
Requires ground-truth relevance labels |
SARP/HM |
Preference consistency |
Only needs clicks from varying menus |
SARP consistency requires no ground truth, no explicit ratings, and no user feedback surveys. It’s computed directly from the data every platform already logs.
Limitations
Menu reconstruction from click-stream is approximate. The “true” menu (what the user actually saw) may differ from items they viewed.
SARP tests for a strict linear order. Real preferences may be incomplete (indifference) or context-dependent.
With large catalogs, sparsity limits the test’s power: if two items never co-occur in a menu, SARP says nothing about their relative ranking.
Session-level analysis assumes within-session independence; fatigue or position bias may create spurious violations.